Risk Management
The risk management team examines regulatory and non-regulatory risks. They also design proper solutions and procedures to prevent and address those risks.
Related: Operational Risk Manager, Risk Management Supervisor, Regulatory Compliance Specialist.
View all
- Percentage of Audit Plan Completed – We aim to increase the Percentage of Audit Plan Completed, ensuring more compliance audit stages are accomplished versus the total possible stages.
- Percentage of Neglected Compliance Issues – We aim to reduce the Percentage of Neglected Compliance Issues, minimizing overlooked compliance issues relative to the total number of compliance issues.
- Number of Insurance Regulatory Reports – We aim to increase the Number of Insurance Regulatory Reports, generating more reports within the determined time period.
- Number of Compliance-Related Lawsuits – We aim to reduce the Number of Compliance-Related Lawsuits, minimizing the yearly number of lawsuits filed against the firm for compliance-related matters.
- Compliance Backlog Percentage – We aim to reduce the Compliance Backlog Percentage, decreasing the percentage of active compliance issues older than 28 days.
- Breach of Customer Privacy Complaints – We aim to reduce the number of Breach of Customer Privacy Complaints, lowering the yearly number of confirmed complaints related to privacy violations and data loss.
- Average Cost of Investigations – We aim to reduce the Average Cost of Investigations, minimizing the total expenditure in ongoing investigations.
- Compliance Training Hours per FTE – We aim to increase Compliance Training Hours per FTE, ensuring more training hours related to compliance for each full-time equivalent employee.
- Average Financial Statement Cost – We aim to reduce the Average Financial Statement Cost, minimizing the expense incurred to generate financial statements.
- Training Headcount Ratio – We aim to improve the Training Headcount Ratio, ensuring an optimal ratio of company-wide staff members to training staff.
- Training Time for Customer Contact – We aim to increase Training Time for Customer Contact, ensuring employees receive adequate training hours before engaging with clients.
- Number of Documents Destroyed – We aim to reduce the Number of Documents Destroyed, minimizing the yearly average of damaged material documents.
- Percentage of Compliance-Related Lawsuits ‘Won’ – We aim to increase the Percentage of Compliance-Related Lawsuits ‘Won’, improving the firm’s success rate in compliance-related lawsuits.
View less
Policy Creation
The policy creation group is authorized to assess and look into risk areas and then design corporate governance, regulations, benchmarks, and workplace guidance that will reduce those known risk areas.
Related: Policy Compliance Analyst, Policy Advisor, Policy Counsel, Compliance Policy Editor.
View all
- Total Legal Spending as a Percentage of Revenue – We aim to reduce Total Legal Spending as a Percentage of Revenue, minimizing the legal expenditure relative to the total profit for the preceding year.
- Average Cost per Compliance-Related Lawsuit – We aim to reduce the Average Cost per Compliance-Related Lawsuit, decreasing the total expenses incurred for compliance-related lawsuits.
- Number of Alerts Tracked – We aim to increase the Number of Alerts Tracked, ensuring more compliance-related alerts are detected and revealed to the compliance team each month.
- Insurance Regulatory Report Line Items – We aim to improve the accuracy and detail of Insurance Regulatory Report Line Items, optimizing the number of line items in each regulatory report.
- Reported Compliance Violations per Employee – We aim to reduce Reported Compliance Violations per Employee, minimizing the number of documented compliance violations per staff member across the company.
View less
Policy Enforcement
The policy enforcement team drafts procedures and rules to handle cases of non-compliance.
Related: Compliance Officer, Enforcement Officer, Code Enforcement Supervisor.
View all
- Total Compliance Employee Headcount – We aim to increase the Total Compliance Employee Headcount, ensuring adequate staffing to manage compliance effectively.
- Total Compliance Operating Expense – We aim to reduce the Total Compliance Operating Expense, managing yearly operating costs for compliance more efficiently.
- Non-Compliant Change Request Percentage – We aim to reduce the Non-Compliant Change Request Percentage, minimizing the number of change requests that do not follow the change management process.
- Percentage of Compliance Issues Handled Correctly – We aim to improve the Percentage of Compliance Issues Handled Correctly, ensuring more disputes are managed properly.
- External Complaints per FTE – We aim to reduce External Complaints per FTE, decreasing the number of external complaints per full-time employee.
- Internal Audits Frequency – We aim to increase Internal Audits Frequency, conducting internal audits more regularly to ensure ongoing compliance.
- Internal Complaints per FTE – We aim to reduce Internal Complaints per FTE, minimizing the number of internal complaints submitted per full-time employee.
- Percentage of Compliant Policies Met – We aim to increase the Percentage of Compliant Policies Met, ensuring more client insurance policies satisfy regulatory specifications.
- Total Regulatory Compliance Expense as a Percentage of Total Revenue – We aim to reduce the Total Regulatory Compliance Expense as a Percentage of Total Revenue, minimizing compliance expenses in relation to total revenue.
- Recurring Identified Improvement Opportunities – We aim to reduce Recurring Identified Improvement Opportunities, minimizing duplicated growth opportunities across multiple assessments.
- Number of Terminated Employee User Accounts Reviewed – We aim to increase the Number of Terminated Employee User Accounts Reviewed, ensuring all discharged employee accounts are audited for compliance with separation procedures.
- Frequency of Policy Revisions – We aim to increase the Frequency of Policy Revisions, reviewing and updating compliance policies more frequently.
- Quarterly Access Review (QAR) Completion Time – We aim to reduce Quarterly Access Review (QAR) Completion Time, completing QARs in fewer business days.
- Financial Non-Compliance Cost as a Percentage of Total Compliance Expense – We aim to reduce the Financial Non-Compliance Cost as a Percentage of Total Compliance Expense, minimizing penalties and costs associated with financial non-compliance.
- Process Improvement Recommendations – We aim to increase Process Improvement Recommendations, suggesting more process enhancements after internal compliance assessments.
- Insurance Regulatory Reporting Cycle Time – We aim to reduce Insurance Regulatory Reporting Cycle Time, completing insurance administrative reports in fewer calendar days.
- Average Rework Cost – We aim to reduce the Average Rework Cost, minimizing the cost of revising financial statements due to errors.
- Compliance Improvement Initiatives – We aim to increase Compliance Improvement Initiatives, launching more internal compliance enhancement projects.
- Average Investigation Cycle Time – We aim to reduce the Average Investigation Cycle Time, completing investigations more quickly.
- Security Incident Downtime – We aim to reduce Security Incident Downtime, minimizing the number of minutes systems are unavailable due to security issues.
- Number of Annual External Complaints – We aim to reduce the Number of Annual External Complaints, lowering the number of complaints issued against the firm with external organizations.
- Total HR Regulatory Compliance Expense – We aim to reduce the Total HR Regulatory Compliance Expense, managing HR administrative compliance costs more efficiently.
- Total Regulatory Compliance Expense – We aim to optimize the Total Regulatory Compliance Expense, minimizing administrative compliance expenses for the preceding year.
- Projects Delayed – We aim to reduce the Number of Projects Delayed, minimizing the number of internal programs interrupted due to compliance concerns.
- Major Internal Compliance Breaches – We aim to reduce Major Internal Compliance Breaches, minimizing large-scale internal compliance violations.
- Number of Investigations – We aim to reduce the Number of Investigations, minimizing the yearly number of ongoing investigations against the firm.
- Insurance Regulatory Report Quantity – We aim to increase the Insurance Regulatory Report Quantity, generating more insurance administrative reports annually.
- Number of Annual Internal Complaints – We aim to reduce the Number of Annual Internal Complaints, minimizing the yearly number of complaints issued internally.
View less
Internal Audit
The internal audit group performs regular assessments of all practices to make sure that they are in compliance with the internal and external protocols pre-defined by the company.
Related: Internal Audit Manager, Director/Manager of Internal Audit, Internal Auditor.
View all
- Percentage of Improvement Opportunities Implemented – We aim to increase the Percentage of Improvement Opportunities Implemented, ensuring more growth opportunities detected in assessments are executed within a year.
- Change Request Issue Resolution Rate – We aim to increase the Change Request Issue Resolution Rate, solving more change request concerns through IT compliance audits and recommendations aligned with the change management process.
- On-Time Insurance Regulatory Reporting Rate – We aim to improve the On-Time Insurance Regulatory Reporting Rate, ensuring a higher percentage of insurance administrative reports are completed on schedule within each regular cycle.
- Percentage of Escalated Compliance Issues – We aim to reduce the Percentage of Escalated Compliance Issues, minimizing the number of compliance issues turned over to the compliance committee.
- Average Time to Implement – We aim to reduce the Average Time to Implement New Regulations, enforcing new rules or regulations more quickly after government review.
- On-Time Financial Report Percentage – We aim to increase the On-Time Financial Report Percentage, ensuring a higher percentage of financial reports are filed on schedule.
- Compliance Training Expense per FTE – We aim to optimize Compliance Training Expense per FTE, managing the amount spent on compliance training per full-time employee.
- Improper Configuration of Assets – We aim to reduce the number of Improper Configuration of Assets, minimizing business compliance concerns resulting from incorrect asset distribution.
View less
Regulatory Reporting
The regulatory reporting group establishes data collection processes then collects and submit reports for the management and government organizations.
Related: Regulatory Reporting Analyst, Regulatory Reporting Manager, Regulatory Specialist.
View all
- Percentage of Strategic Objectives Achieved – We aim to increase the Percentage of Strategic Objectives Achieved, ensuring more strategic efforts are accomplished according to the yearly management plan.
- Total Regulatory Compliance Expense as a Percentage of Total Expense – We aim to reduce the Total Regulatory Compliance Expense as a Percentage of Total Expense, optimizing the expenditure budgeted for HR administrative compliance relative to total operating costs.
- Regulatory Compliance Expense per FTE – We aim to optimize Regulatory Compliance Expense per FTE, managing the total compliance expenditure per full-time equivalent employee more efficiently.
- Regulatory Report Creation Cycle Time – We aim to reduce the Regulatory Report Creation Cycle Time, minimizing the average time required to gather information, generate, and file administrative reports.
- Regulatory Compliance Expense per Regulatory Compliance Employee – We aim to reduce Regulatory Compliance Expense per Regulatory Compliance Employee, optimizing the total compliance expenditure per HR administrative compliance staff.
- Number of Annual Securities Compliance Issues – We aim to reduce the Number of Annual Securities Compliance Issues, minimizing the total number of security-related compliance issues reported annually.
- Financial Statement Accuracy – We aim to increase Financial Statement Accuracy, ensuring a higher percentage of financial statements submitted without needing revision.
- Non-Compliance Cost Percentage – We aim to reduce the Non-Compliance Cost Percentage, minimizing penalties acquired for non-adherence to regulations relative to the total compliance expenditure.
- External Training Budget per Employee – We aim to optimize the External Training Budget per Employee, ensuring effective allocation of the external training budget per full-time equivalent employee.
- HR Compliance Headcount Ratio – We aim to improve the HR Compliance Headcount Ratio, ensuring an optimal balance between firm-wide staff and HR compliance staff.
- IT Security Expense to IT Asset Value Ratio – We aim to reduce the IT Security Expense to IT Asset Value Ratio, optimizing IT security expenditure relative to the total value of IT assets under management.
- Reporting Expense as a Percentage of Total Compliance Expense – We aim to reduce Reporting Expense as a Percentage of Total Compliance Expense, managing administrative reporting costs more effectively as a portion of total compliance expenditure.
- Ratio of Firm-Wide Employees to Compliance Employees – We aim to improve the Ratio of Firm-Wide Employees to Compliance Employees, ensuring an appropriate balance of compliance staff relative to the total firm-wide workforce.
- Percentage of Downtime Due to Security Incidents (by system) – We aim to reduce the Percentage of Downtime Due to Security Incidents (by system), minimizing outages caused by security violations across IT systems.
- Regulatory Reporting Expense as a Percentage of Total Expenses – We aim to reduce the Regulatory Reporting Expense as a Percentage of Total Expenses, optimizing the cost of compliance administrative reporting relative to total operating expenses.
- Internal Audit Cycle Time – We aim to reduce Internal Audit Cycle Time, minimizing the time needed to conduct complete internal audits, categorized by audit type.
- On-Time Regulatory Compliance – We aim to increase On-Time Regulatory Compliance, ensuring timely adherence to new regulations within the preceding year.
- Number of Compliance Personnel in HR – We aim to increase the Number of Compliance Personnel in HR, ensuring sufficient staff are dedicated to compliance adherence in the HR department.
View less
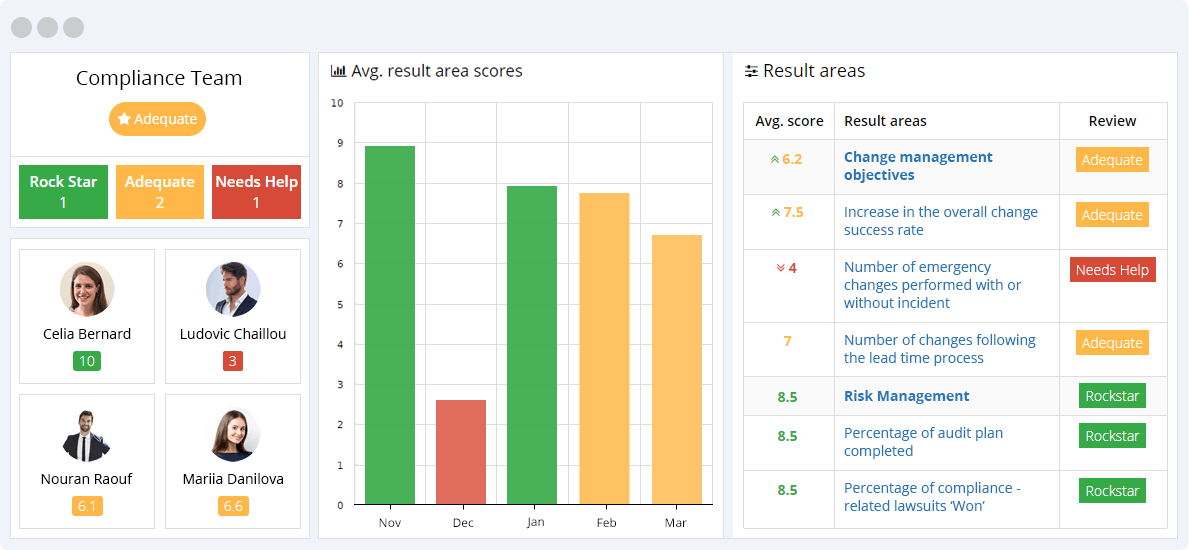
Change management objectives
Change management objectives (KPIs) are designed to measure the changes implemented by a company’s successes and failures. Creating and driving positive change in an organization is hard work, and the program’s implementation must be carefully tracked and monitored. Otherwise, the attempted changes might fail, resulting in negative company culture.
- Increase in the overall change success rate – We aim to increase the overall change success rate, ensuring the success of the change implementation program as measured by Request for Comments (RFC) or review.
View all
- Number of changes following the lead time process – We aim to increase the number of changes following the lead time process, ensuring more changes adhere to the lead time process before the life cycle of change implementation is completed.
- Reduction in the number of incidents attributing to changes – We aim to reduce the number of incidents attributed to changes, minimizing incidents that prompt the change management program, indicating successful implementation.
- Changes performed during business hours – We aim to increase the success of changes performed during business hours, ensuring smoother implementation of changes despite constraints during operational hours.
- Number of emergency changes performed with or without incident – We aim to reduce the number of emergency changes performed with or without incident, decreasing emergency change requests, indicating fewer urgent service or maintenance flaws.
- Percentage of unauthorized changes – We aim to reduce the percentage of unauthorized changes, minimizing changes implemented without approved, registered change requests.
- Percentage of incidents caused by changes – We aim to reduce the percentage of incidents caused by changes, lowering the percentage of incidents resulting from change implementation.
- Percentage of emergency changes – We aim to reduce the percentage of emergency changes, minimizing the need for emergency changes by improving proactive management and planning.
- Percentage of successful changes – We aim to increase the percentage of successful changes, ensuring a higher rate of closed changes are successfully implemented in a given period.
- Percentage of backed out changes – We aim to reduce the percentage of backed-out changes, minimizing the need for remedy plans on closed changes.
- Percentage of rejected changes – We aim to reduce the percentage of rejected changes, decreasing the percentage of closed changes denied during a given period.
- Average time per phase – We aim to reduce the average time per phase, ensuring quicker progress through the distinct phases of the change management process.
- Performance results – We aim to improve performance results, enhancing overall performance as a consequence of the change management program.
- Effectiveness of training and communication – We aim to improve the effectiveness of training and communication, ensuring that employees receive adequate training and that the need for change is communicated effectively.
- Participation in training sessions and meetings – We aim to increase participation in training sessions and meetings, boosting employee involvement in the change’s training sessions and meetings for successful implementation.
- Adherence to the project plan – We aim to improve adherence to the project plan, ensuring that change management programs are completed on time and within budget, aligned with the project plan.
- Project goal performance – We aim to improve project goal performance, ensuring the individual goals of the change request’s project plan are met on time and within budget.
View less
Compliance Manager Job Objectives
- Reducing the number of Compliance Incidents – Measures the total number of compliance incidents or breaches reported within a specific period.
- Compliance Training Effectiveness – Evaluates the quality and impact of compliance training programs.
View all
- Improving the Incident Resolution Rate – Indicates the compliance team’s effectiveness in addressing and resolving compliance issues promptly.
- Improving the Policy and Procedure Adherence Rate – Measures the degree to which employees comply with established policies and procedures.
View less
The compliance department is responsible for labor law compliance, internal and external risk management, internal audit processes, the development and implementation of company policies and procedures, as well as the submission regulatory reporting requirements.
These aspects form a critical part of the organization’s ability to be successful and fulfill its core function.
Real-time KPI management and tracking ensure that the Compliance Executive can ensure that employees meet the stated Key Performance Indicators as set out by the organization. Equally importantly, management can identify negative trends in the department and take action to ensure the optimal functioning of the organization.