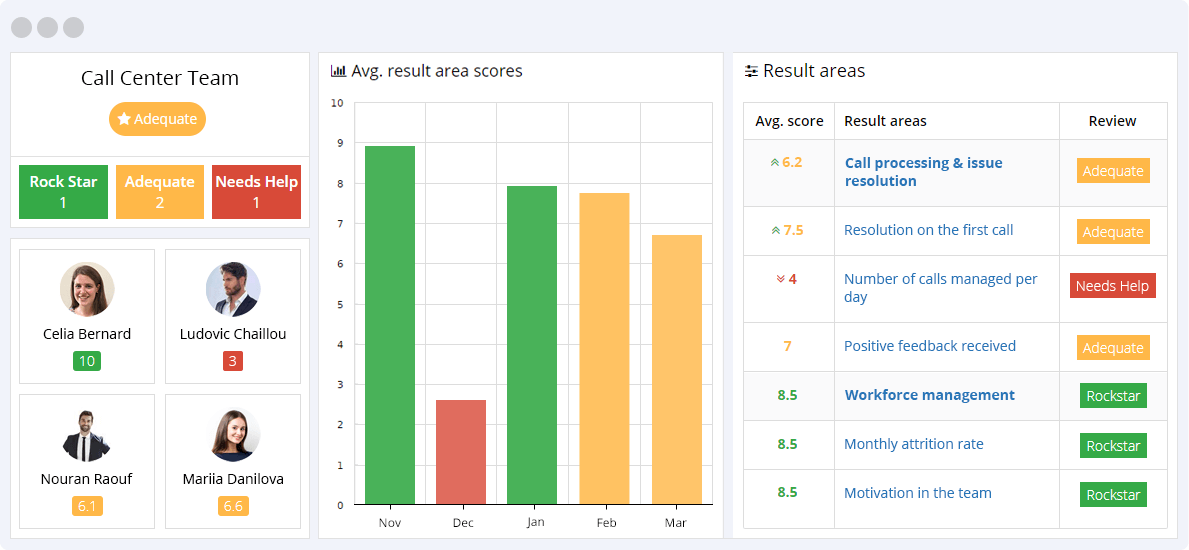
Call Processing & Issue Resolution
Call processing and issue resolution KPIs measure the effectiveness of call center agents in handling customer issues and resolving them in a timely and satisfactory manner.
Related: Call Center Administrator, Customer Service Administrator, Client Services Administrator, Customer Service Representative, Call Center Agent, Call Center Representative, Customer/Client Support Representative, Technical Support Representative.
- Average Handle Time (AHT) – We strive to reduce the Average Handle Time (AHT), which is the average number of seconds needed to deal with one inbound client call, including any post-call tasks needed.
View all
- Average Hold Time – We strive to reduce the Average Hold Time, the average number of seconds that a client is kept on hold throughout the duration of a call, as well as between transfers.
- Average Speed of Answer (ASA) – We strive to reduce the Average Speed of Answer (ASA), which is the average amount of time a caller needs to wait before a Contact Center agent picks up the call.
- Average Handle Time: After-Call Work – We strive to reduce the Average Handle Time: After-Call Work, the average number of seconds needed to handle post-call tasks after one call is finished over a specific term.
- Average Talk Time – We strive to reduce the Average Talk Time, which is the average number of seconds needed to deal with one inbound client call, not including any post-call tasks needed.
- Transfer Rate – We strive to reduce the Transfer Rate, the percentage of inbound calls that must be turned over to another staff member to be settled compared to the overall number of inbound calls.
- Abandonment Rate – We strive to reduce the Abandonment Rate, which is the percentage of callers who abort the call before talking to a Contact Center agent compared to the total number of callers during a similar term.
- Calls Offered – We strive to manage the Calls Offered effectively, referring to the total number of inbound calls to the Call Center over a specific term.
- Calls Handled – We strive to increase the Calls Handled, the total number of inbound calls handled by the Contact Center agents during a stated term.
- Forecast Accuracy: Calls Offered – We strive to improve Forecast Accuracy for Calls Offered, which is the percentage difference between calls projected and the actual calls performed over a stated term.
- Calls Handled per Representative – We strive to increase the Calls Handled per Representative, the average number of incoming and outgoing calls Call Center agents deal with divided by the total number of Call Center agents employed over a specific term.
- Average Handle Time: Call Closing – We strive to reduce the Average Handle Time: Call Closing, the average number of seconds needed to handle call-closing tasks throughout the duration of one call over a specific term.
- SLA Adherence: Speed of Answer – We strive to improve SLA Adherence: Speed of Answer, ensuring a higher percentage of calls are picked up within a predetermined speed-to-answer duration.
- Percentage of Right Party Contacts – We strive to increase the Percentage of Right Party Contacts, the percentage of outgoing calls made to accurate phone numbers versus the overall number of outgoing calls.
- First Contact Resolution Rate – We strive to improve the First Contact Resolution Rate, the percentage of incoming calls that are settled on the initial contact without necessary transfers or follow-ups.
- Average Handle Time (Inbound and Outbound) – We strive to reduce the Average Handle Time (Inbound and Outbound), the average amount of time needed to deal with one inbound or outbound client call, including any post-call tasks needed.
- Cost per Call – We strive to reduce the Cost per Call, calculated by dividing Call Center expenditure by the overall number of calls accepted over a specified term.
- Cost per Minute of Inbound Handle Time – We strive to reduce the Cost per Minute of Inbound Handle Time, which is the call center expenditure divided by the amount of incoming call airtime (in minutes) over a stated term.
- Contacts per Call Center Representative – We strive to increase Contacts per Call Center Representative, the number of calls, emails, and chat invitations managed divided by the total number of Contact Center staff over a stated term.
- Outbound Calls per Representative – We strive to increase the Outbound Calls per Representative, the average number of outgoing calls initiated by an agent over a specified term.
- Email and Chat Contacts per Email and Chat Representative – We strive to increase the Email and Chat Contacts per Email and Chat Representative, the number of email and online chat contacts made over a stated term, divided by the number of agents devoted to these contact categories.
- Email and Chat Contacts as a Percentage of Total Contacts – We strive to increase Email and Chat Contacts as a Percentage of Total Contacts, reflecting the growing use of digital communication channels.
- Number of Holds per Call – We strive to reduce the Number of Holds per Call, the average number of times clients are put on hold during one call over a stated term.
- Total Number of Holds – We strive to reduce the Total Number of Holds, the total number of instances that clients are put on hold by Call Center agents over a specific term.
- Transfer Volume by Call Reason – We strive to reduce the Transfer Volume by Call Reason, decreasing the total number of call transfers categorized by the purpose of the call.
- Transfer Destinations – We strive to reduce unnecessary Transfer Destinations, lowering turnover volume categorized by the department or group the call is being transferred to.
- Calls Handled per IT Help Desk Employee – We strive to increase Calls Handled per IT Help Desk Employee, boosting the average number of calls about matters that require resolution divided by the number of IT service desk staff over a stated date.
- Average Handle Time (AHT) by Call Reason – We strive to reduce the Average Handle Time (AHT) by Call Reason, decreasing the average amount of time needed to deal with a client call, categorized by the purpose of the call or procedure.
- Resolution on the first call – We strive to improve Resolution on the First Call, enhancing our ability to manage and successfully close support calls on the first attempt.
- Number of calls managed per day – We strive to increase the Number of Calls Managed per Day, indicating the total number of calls handled by each person on a given day, including both inbound and outbound calls.
- Positive feedback received – We strive to increase Positive Feedback Received, boosting the number of instances staff receive positive feedback from customers upon successful resolution of their issues.
View less
Workforce Management
Call center workforce management KPIs track the performance of agents and the overall efficiency of the workforce. These metrics include metrics such as average handle time, service level, occupancy rate, adherence to schedule, and shrinkage. By monitoring these KPIs, call center managers can optimize staffing levels and improve productivity.
Related: Call Center Administrator, Customer Service Administrator, Client Services Administrator, Call Center Workforce Analyst, Workforce Management Specialist.
- Call Center Shrink Rate – We strive to reduce the Call Center Shrink Rate, which is the percentage of time that Contact Center agents spend away from the phone and not available to receive calls versus the total appointed time.
View all
- Shrink Time Due to Breaks – We strive to reduce Shrink Time Due to Breaks, which refers to the amount of time that Contact Center agents spend away from the phone due to breaks divided by the total appointed time.
- Shrink Time Due to Meetings – We strive to reduce Shrink Time Due to Meetings, the percentage of time that Call Center agents are away from the phone due to meetings divided by the total planned time.
- Shrink Time Due to Offline Activities – We strive to reduce Shrink Time Due to Offline Activities, the percentage of time that Call Center agents spend away from the phone due to offline duties like internal communications or impromptu requests from managers.
- Shrink Time Due to Coaching – We strive to reduce Shrink Time Due to Coaching, which is the percentage of time that Call Center agents are away from the phone for coaching, divided by the total appointed time.
- Shrink Time Due to Training – We strive to reduce Shrink Time Due to Training, the percentage of time that Call Center agents are away from the phone due to training divided by the total planned time.
- Occupancy Rate – We strive to improve the Occupancy Rate, the percentage of time that an agent spends dealing with calls versus the total time logged in and available to accept calls.
- Shrink Time Due to Absences – We strive to reduce Shrink Time Due to Absences, the percentage of time that Call Center agents are away from the phone due to absences versus the overall appointed time.
- Shrink Time Due to Vacation – We strive to reduce Shrink Time Due to Vacation, the percentage of time that Contact Center agents spend away from the phone due to vacation divided by the total appointed time.
- Schedule Adherence – We strive to improve Schedule Adherence, ensuring agents are accurately logged into the appointed task as a percentage of their total logged-in time.
- Contact Center Representative Headcount – We strive to maintain or optimize Contact Center Representative Headcount, the total number of agents working within the call center at a specific date, categorized by call sequence, product, or group.
- Span of Control: Call Centers – We strive to optimize the Span of Control for Call Centers, ensuring a manageable average number of Contact Center agents reporting per manager.
- Total Expense: Call Center – We strive to control the Total Expense of the Call Center, managing the overall expenditure of the company’s Contact Center over a stated date.
- Contact Center Manager Headcount – We strive to optimize Contact Center Manager Headcount, the total number of managers employed at the call center at a specific date.
- Quality Score – We strive to improve the Quality Score, which is the average score appointed to call center agents based on the quality of calls observed by managers.
- Customer Satisfaction Rate – We strive to increase the Customer Satisfaction Rate, the percentage of clients who report that they are happy with the service provided by Contact Center agents.
- Call Center Headcount Ratio – We strive to reduce the Call Center Headcount Ratio, optimizing the ratio of firm-wide FTES compared to the overall number of Contact Center agents.
- Absenteeism – We strive to reduce Absenteeism, lowering the percentage of agents within the Contact Center staff who are absent during their appointed shifts versus the number of agents required to work.
- Utilization Rate – We strive to increase the Utilization Rate, the percentage of time that an agent spends on the phone dealing with client calls versus the total time served.
- Representatives as a Percentage of Call Center Employees – We strive to increase Representatives as a Percentage of Call Center Employees, optimizing the percentage of agents employed versus the total number of staff within the Contact Center.
- New Representative Training Hours – We strive to increase New Representative Training Hours, ensuring newly hired Contact Center agents receive ample training over a stated date.
- Calls Monitored per Representative – We strive to increase Calls Monitored per Representative, the total number of calls observed by Call Center administrators over a specific date divided by the number of agents.
- Silent Monitoring – We strive to improve Silent Monitoring, the average yearly amount of silent monitoring performed per agent to provide appropriate coaching and training.
- Calls Handled by Call Reason – We strive to improve Calls Handled by Call Reason, categorizing the total number of calls dealt with by their purpose to optimize agent handling processes.
- Monthly attrition rate – We strive to reduce the Monthly Attrition Rate, lowering the percentage of customers leaving the company’s services in a given period.
- Motivation in the team – We strive to increase Motivation in the Team, encouraging positive reinforcement and efforts to maintain high performance until tasks are completed.
View less
Call Center Training & Coaching
Call center training and coaching KPIs measure the effectiveness of the training programs and coaching provided to call center agents, including metrics such as average handle time improvement, call quality improvement, and employee satisfaction with training.
Related: Contact Center Administrator, Team Leader, Customer Service Administrator, Client Services Administrator, Call Center Trainer/Coach, Senior Call Center Representative/Agent.
- Quality Score – We strive to improve the Quality Score, an average score appointed to call center agents based on the quality of calls observed by managers.
View all
- Customer Retention Rate – We strive to increase the Customer Retention Rate, the percentage of current clients retained over a specified period.
- Customer Satisfaction Rate – We strive to improve the Customer Satisfaction Rate, the percentage of clients satisfied with the level of service provided by Contact Center agents.
- Representative Job Satisfaction – We strive to increase Representative Job Satisfaction, the percentage of Call Center agents who report they are happy in their roles.
- Representative Training Hours – We strive to increase Representative Training Hours, the average number of training hours an agent receives over a specified term.
- Average Annual Pay: Call Center Representative – We strive to optimize the Average Annual Pay for Call Center Representatives, ensuring fair compensation for agents based on wages, rewards, and commissions.
- Average Annual Pay: Call Center Manager – We strive to optimize the Average Annual Pay for Call Center Managers, managing compensation for administrators effectively.
- Percentage of Calls Monitored – We strive to increase the Percentage of Calls Monitored, the proportion of calls observed by Call Center administrators or training personnel.
- Silent Monitoring – We strive to increase the frequency of Silent Monitoring, where administrators listen to calls to provide the right level of coaching and training.
- Staff Telephone Etiquette – We strive to improve Staff Telephone Etiquette, ensuring agents comply with the firm’s telephone standards, as measured on a 1-10 scale.
- Number of Calls Monitored – We strive to increase the Number of Calls Monitored, the total number of calls observed by administrators over a specific term.
- Call Center Training Expense as a Percentage of Total Call Center Expense – We strive to manage Call Center Training Expense as a Percentage of Total Call Center Expense, balancing expenditure for training with overall Contact Center costs.
- Number of Quality Scores by Representative – We strive to increase the Number of Quality Scores per Representative, the number of instances an agent is given a quality score based on observed calls.
- Total Expense: Contact Center Training – We strive to manage the Total Expense of Contact Center Training, optimizing spending on training over a specific term.
- Annual Review Volume – We strive to increase the Annual Review Volume, the number of yearly reviews performed to provide agents with constructive criticism.
- Management Levels: We strive to improve the Management Levels in Contact Center Training & Coaching, ensuring a clear structure for training and coaching.
- Training Hours versus Budgeted – We strive to balance Training Hours versus Budgeted, ensuring agents receive sufficient training within the allotted hours scheduled by management.
- Annual Representative Training Hours – We strive to increase Annual Representative Training Hours, providing ample training hours for agents each year.
- Call-Recording Use – We strive to ensure Call-Recording Use, confirming the use of call-recording tools for quality assurance and training.
- Span of Control: Training & Coaching Representatives – We strive to optimize the Span of Control for Training & Coaching Representatives, ensuring an effective ratio of agents reporting to each training administrator.
- Side-by-Side Monitoring – We strive to increase Side-by-Side Monitoring, the amount of annual side-by-side observation provided to agents for coaching.
- Total Coaching/Training Hours – We strive to increase the Total Coaching/Training Hours, providing agents with enough coaching and training time to deliver outstanding customer support.
- Frequency of Formal Employee Evaluations – We strive to improve the Frequency of Formal Employee Evaluations, ensuring regular performance assessments are conducted.
- Coaching Hours versus Budgeted – We strive to balance Coaching Hours versus Budgeted, aligning the total hours of coaching with the scheduled time.
- Unit Cost: Training – We strive to reduce the Unit Cost of Training, minimizing the cost of training per agent while maintaining quality.
- Training Days per Year – We strive to increase Training Days per Year, dedicating more days each year to training employees effectively.
View less
Call Center Technical Support
Call Center Technical Support KPIs are used to measure the technical support team’s ability to resolve customer issues effectively, efficiently and within a set timeframe, as well as their knowledge and expertise in troubleshooting technical problems.
Related: Contact Center Systems Engineer/Architect, Contact Center Engineering Administrator, Contact Center Business Operations Architect, Call Center Technical Support Technician, Systems Analyst.
- Percentage of Outage -We strive to reduce the Percentage of Outage, minimizing the time during which a technical system is disabled compared to the total operating uptime.
View all
- Percentage of Tickets Delivered within Service Level Agreement (SLA) – We strive to increase the Percentage of Tickets Delivered within Service Level Agreement (SLA), ensuring more tickets are addressed within the expectations established by the firm.
- Time Spent on Software and Warranty Returns (in Hours) – We strive to reduce Time Spent on Software and Warranty Returns (in Hours), minimizing the average time Technical Service agents spend handling returns daily.
- Total Expense: Technical Support – We strive to reduce the Total Expense of Technical Support, optimizing the total expenditure of the Technical Support office over a particular period.
- Span of Control: Technical Support Representatives – We strive to optimize the Span of Control for Technical Support Representatives, ensuring a manageable number of agents reporting to each Technical Service administrator.
- Technical Support Representatives as a Percentage of Total Call Center Representatives – We strive to increase Technical Support Representatives as a Percentage of Total Call Center Representatives, ensuring an appropriate ratio of technical service agents to total call center agents.
- Total Tickets Closed – We strive to increase the Total Tickets Closed, completing more technical service tickets within a given time period.
- Daily Total Active Requests by Type – We strive to effectively manage Daily Total Active Requests by Type, ensuring a balanced workload by monitoring active technical service requests by category.
- System Response Time – We strive to improve System Response Time, reducing the typical system response time for Technical Service personnel.
- Reopened Tickets – We strive to reduce Reopened Tickets, minimizing the number of tickets that are reopened due to unresolved issues.
- Average Resolution Time – We strive to reduce the Average Resolution Time, settling technical service inquiries more efficiently.
- Total Headcount: Call Center Technical Support Representatives – We strive to maintain or increase the Total Headcount of Call Center Technical Support Representatives, ensuring adequate staffing levels to meet support needs.
- Average Tickets Closed per Employee – We strive to increase the Average Tickets Closed per Employee, improving the productivity of staff members solving technical issues.
- Daily Maximum Resolution Time – We strive to reduce the Daily Maximum Resolution Time, minimizing the maximum time needed to resolve technical service inquiries.
- Software and Warranty Returns Processed per Day – We strive to increase Software and Warranty Returns Processed per Day, handling more returns efficiently on a daily basis.
- Technical Support Representative Headcount Ratio – We strive to effectively manage the Technical Support Representative Headcount Ratio, balancing the number of firm-wide full-time employees (FTEs) with technical service call center agents.
- Management Levels: Contact Center Technical Support – We strive to optimize the Management Levels in Contact Center Technical Support, ensuring an efficient structure with appropriate managerial tiers.
- Total Returns Processed Ratio – We strive to improve the Total Returns Processed Ratio, handling a higher ratio of returns relative to total sales.
- Maximum Peak Downtime – We strive to reduce the Maximum Peak Downtime, minimizing the maximum time for which a system or software is down, preventing agents from accomplishing tasks.
View less
IVR/VRU Development & Maintenance
IVR/VRU (Interactive Voice Response/Voice Response Unit) Development & Maintenance KPIs are used to measure the effectiveness and efficiency of the IVR/VRU system, including metrics such as call deflection rate, self-service success rate, and system uptime.
Related: Contact Center Systems Engineer/Architect, Contact Center Engineering Administrator, Contact Center Business Operations Architect, IVR Developer, IVR Analyst, Business Analyst, Systems Engineer.
- IVR/VRU Containment Rate – We strive to increase the IVR/VRU Containment Rate, ensuring a higher percentage of inbound calls are managed entirely by the IVR/VRU system without the need for live agent assistance.
View all
- IVR/VRU Exit Points – We strive to reduce IVR/VRU Exit Points, minimizing the number of exits through each IVR switch press path over a particular time period.
- Total Revenue: IVR/VRU System – We strive to increase Total Revenue from the IVR/VRU System, maximizing the profit earned by the system over a specific time period.
- IVR/VRU Authentication Rate – We strive to improve the IVR/VRU Authentication Rate, ensuring a higher percentage of clients are accurately recognized through the data provided via the IVR/VRU system.
- Total Incoming Calls (IVR/VRU System) – We strive to increase the Total Incoming Calls for the IVR/VRU System, ensuring efficient handling of all inbound calls accepted by the system within a specific period.
- Total Expense: IVR/VRU System – We strive to reduce the Total Expense of the IVR/VRU System, controlling costs and improving the overall efficiency of the system.
- IVR/VRU Utilization Rate – We strive to reduce the IVR/VRU Utilization Rate, transferring fewer calls to live agents by improving the self-service capabilities of the IVR/VRU system.
- Average Time Spent in IVR – We strive to reduce the Average Time Spent in IVR, ensuring clients spend less time navigating the system before ending the call or being transferred.
View less
The call center department’s KPIs or Key Performance Indicators propose to measure the organization’s ability to manage customer relations and the resolution of issues arising from client interactions.
Within this department, the critical performance areas that must be measured include workforce management, employee training to ensure customer satisfaction, staff compliance, technical support processes, the management of IVR/VRU system (software), and the call center agent’s ability to process customer calls expediently and successfully.
Real-time KPI tracking allows the Call Centre Administrator to identify negative trends and to take aggressive and decisive measures to rectify these tendencies before they evolve into crises.