Technical & Product Support (Customer) (Qualitative)
The technical and product support office renders customer service associated with a specific product or service.
Related: Product Support Representative, Customer Support Analyst, Technical Support/Service Representative, Help Desk Administrator
View all
- Customer Satisfaction – The overall customer service representatives’ performance from the customer’s perspective, usually determined by a brief, scale-based survey.
View less
Technical & Product Support (Customer)
Technical and Product Support (Customer) KPIs are designed to measure the efficiency of customer service representatives in resolving technical or product-related issues and improving customer satisfaction levels.
- Abandonment Rate – We aim to reduce the Abandonment Rate, minimizing the percentage of callers who end the call before reaching a technical support agent.
- Cost per Call – We aim to reduce the Cost per Call, optimizing the overall cost of managing calls, including labor and overhead expenses.
View all
- First Contact Resolution Rate – We aim to increase the First Contact Resolution Rate, ensuring more incoming calls are resolved on the initial contact without transfers or follow-ups.
- Average Hold Time – We aim to reduce the Average Hold Time, minimizing the amount of time clients wait on hold during and between call transfers.
- Average Reply Time (Emails) – We aim to reduce the Average Reply Time (Emails), ensuring quicker response times to customer service emails in the technical service process.
- Calls per Product – We aim to increase the number of Calls per Product, resolving more inbound technical service calls related to specific products.
- Training Hours per Year – We aim to increase Training Hours per Year, providing more time for new skills training for technical client services agents annually.
View less
Account Management
Account Management KPIs are designed to measure the effectiveness of managing key accounts and meeting their needs and expectations while driving revenue growth and customer retention.
- Frequency of Account Reviews – We aim to increase the Frequency of Account Reviews, ensuring accounts are reviewed more frequently to verify service quality, client relationships, and customer experience.
- Average Time Between Customer Interactions – We aim to reduce the Average Time Between Customer Interactions, minimizing the time that transpires between interactions with customers.
View all
- Number of Customer Accounts per Account Manager – We aim to optimize the Number of Customer Accounts per Account Manager, ensuring a manageable number of client accounts per account administrator.
- Contacts per Account – We aim to increase Contacts per Account, fostering more frequent interactions between account administrators and clients through phone, email, and face-to-face communications.
View less
Customer Incentive & Rewards
Customer Incentive & Rewards KPIs are designed to measure the effectiveness of customer incentive and loyalty programs. They track metrics such as customer retention rates, redemption rates, and customer satisfaction with the rewards offered.
Related: Customer Experience Specialist, Customer Loyalty Specialist, Customer Success Specialist, Customer Relations Manager
View all
- Net Promoter Score – We aim to increase the Net Promoter Score, ensuring a higher percentage of clients endorse the brand to their contacts.
- Enrollment Conversion Rate – We aim to increase the Enrollment Conversion Rate, encouraging more clients to register in the customer incentive program during the specified term.
- Customer Retention Rate – We aim to increase the Customer Retention Rate, ensuring more customers extend their services or make new purchases during the specified term.
- Customer Churn Rate – We aim to reduce the Customer Churn Rate, minimizing the percentage of customers who choose not to extend their subscriptions.
- Lifetime Customer Value – We aim to increase the Lifetime Customer Value, maximizing the net profit acquired from one client over the lifetime relationship.
- Rewards Break Rate – We aim to reduce the Rewards Break Rate, ensuring a lower percentage of accumulated premiums go unredeemed by members of the customer incentive program.
- Rewards Accrual Rate – We aim to increase the Rewards Accrual Rate, encouraging a higher value of premiums accumulated by the typical client as a percentage of their overall purchases.
- Cancellation Rate – We aim to reduce the Cancellation Rate, minimizing the percentage of customer incentive program members who terminate their subscription during the specified term.
- Rewards Attainability – We aim to increase Rewards Attainability, ensuring more reward program members redeem their accumulated premium points/credits during the specified term.
View less
Returns & Warranty
Returns & Warranty KPIs are designed to measure and track the efficiency of the returns and warranty processes, including the time it takes to resolve customer issues and the cost of returns.
- Returned Product Transportation Cost – We aim to reduce the Returned Product Transportation Cost, minimizing the total expenses for shipping returned merchandise by clients.
- Percentage of Invalid Claims – We aim to reduce the Percentage of Invalid Claims, minimizing the number of void claims compared to the total claims received.
View all
- Warranty Cost as a Percentage of Revenue – We aim to reduce Warranty Cost as a Percentage of Revenue, lowering the total expenses related to warranty returns and service concerns relative to gross profit.
- Warranty Claims as a Percentage of COGS – We aim to reduce Warranty Claims as a Percentage of COGS, minimizing the expenses in handling warranty claims compared to the total cost of goods sold.
- Daily Customer Returns – We aim to reduce the Daily Customer Returns, decreasing the average number of products returned and handled by the returns supervision team each day.
View less
Customer Service
Customer Service KPIs are measurable values that track how well a company is delivering customer service. They include metrics such as customer satisfaction, first call resolution, average handling time, and response time.
- Complaint Resolution Time – We aim to reduce Complaint Resolution Time, minimizing the amount of time required to resolve customer complaints and ensuring faster, more efficient resolutions to improve customer satisfaction.
- Customer Complaints Log – We aim to improve the Customer Complaints Log, ensuring accurate and thorough documentation of customer complaints to help track issues, identify patterns, and address recurring problems more effectively.
View all
- Customer Satisfaction – We aim to increase Customer Satisfaction, enhancing the overall experience for clients by improving service quality and ensuring that customer needs are met promptly and efficiently.
- Average Handling Time – We aim to reduce Average Handling Time, minimizing the time taken to handle customer inquiries or issues, improving efficiency without compromising the quality of support provided.
- Quality of Written Communication – We aim to improve the Quality of Written Communication, ensuring that all written interactions with customers, including emails and chat, are clear, professional, and effective in resolving queries or concerns.
View less
Incident Management
Customer service incident management KPIs track the efficiency and effectiveness of resolving customer complaints and issues. These KPIs include the time to resolve an incident, customer satisfaction levels, the number of repeat incidents, and the cost per incident.
Related: Incident Manager, Incident Management Specialist, Incident Analyst, Incident Response Manager, Escalation Manager, Customer Service Manager
View all
- Percentage of Accounts Past Due – We aim to reduce the Percentage of Accounts Past Due, minimizing the number of customer accounts that are overdue and require collection efforts.
- Average Age (Delinquent Accounts) – We aim to reduce the Average Age of Delinquent Accounts, shortening the number of days that accounts remain overdue, ensuring quicker resolutions.
- Incidents per Account – We aim to reduce Incidents per Account, minimizing the number of customer inquiries or service issues per client account, thereby improving overall service quality.
- Cost per Incident – We aim to reduce the Cost per Incident, optimizing the costs associated with incident management by improving efficiency and resource allocation.
- Average Handle Time – We aim to reduce Average Handle Time, ensuring that inbound calls are managed more efficiently, including post-call tasks, without compromising service quality.
- Average Complaints per Day – We aim to reduce Average Complaints per Day, minimizing the daily number of customer grievances received, indicating improved service and product satisfaction.
- Complaint Escalation Rate – We aim to reduce the Complaint Escalation Rate, ensuring that fewer technical or product complaint calls need to be escalated to administrators, resolving more issues at the agent level.
View less
Client Service
Client service KPIs measure the effectiveness of providing high-quality service to clients by evaluating their satisfaction levels and feedback. These KPIs include metrics such as response time, resolution time, client retention rates, and overall client satisfaction. Improving these KPIs can lead to increased client loyalty and repeat business.
- Maintain consistent data in Smart Office – We aim to improve the consistency of data in Smart Office, ensuring contact, activity, investment, insurance policy, and other data are maintained according to Team standards.
- Meet with clients at least annually – We aim to increase the frequency of client meetings, ensuring all clients are met with at least annually, either through direct meetings (Advisor Associate and Financial Advisor) or facilitated meetings (Practice Manager).
View all
- Overall client service – We aim to improve overall client service, gathering feedback and identifying areas for enhancement to deliver a better client experience.
- Present a positive, professional and cheerful manner – We aim to improve the presentation of a positive, professional, and cheerful manner, ensuring all client interactions are conducted with a positive and professional approach.
- Respond to clients’ needs – We aim to improve responsiveness to clients’ needs, ensuring that all client communications are responded to within 24 hours, clearly outlining how and when their needs will be resolved.
- Use of Smart Office – We aim to increase the proper use of Smart Office, ensuring the system is used appropriately to log all interactions with clients, contacts, and service providers according to Team standards.
View less
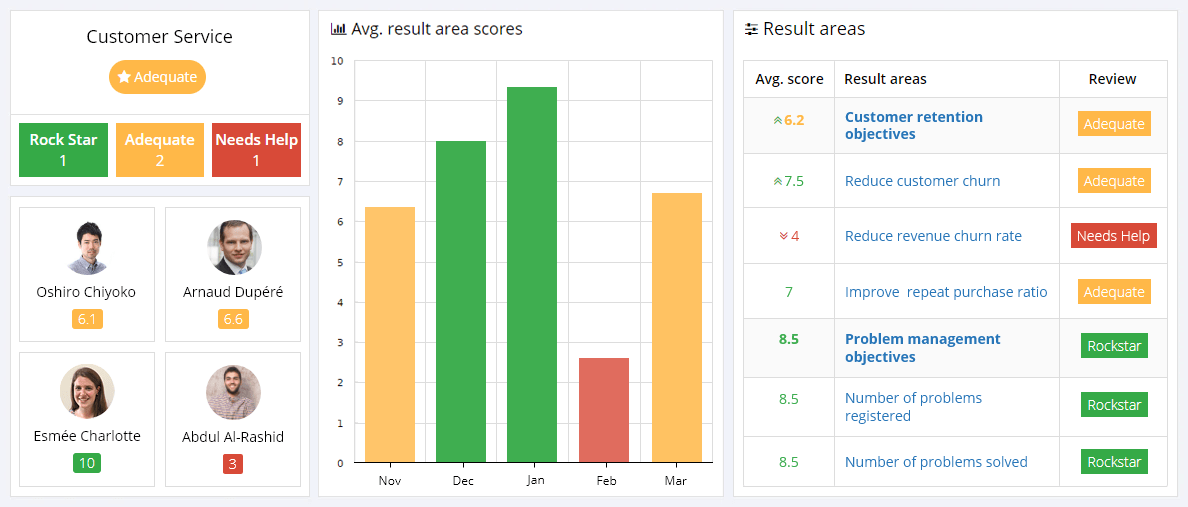
Customer Retention Objectives
Customer retention objectives or KPIs are designed to measure the organization’s capacity to retain customers over the long-term and generate new revenue from these long-term clients. Customer retention strategies are the most important strategies a company has to get right: the higher this metric, the greater its income generation abilities.
- Reduce customer churn – Customer churn is defined as the percentage of your customers who have stopped buying your products or services over time. This KPI measures and tracks the customer churn percentage. And it is calculated by dividing the number of customers lost by the total number of customers for the specified period.
- Reduce the revenue churn rate – The revenue churn rate is the percentage of revenue the company has lost from existing customers over time. The revenue churn rate is a significant indicator of customer health and satisfaction. The lower the churn rate, the more satisfied the organization’s customers.
View all
- Improve the existing customer revenue growth rate – The existing customer revenue growth rate measures the company’s existing customer base’s income growth rate. This existing customer base provides the company with significant potential for value creation. Current customers are already loyal to the company’s brand; thus, it is much easier to encourage repeat sales than convert new customers.
- Improve the repeat purchase ratio – The repeat purchase ratio is a useful indicator of customer loyalty. It is used by marketing and sales teams to assess team performance and the impact of the customer retention strategy. The higher the repeat purchase ratio is, the more successful the company’s customer retention strategy.
- Reduce the product return rate – The product return rate measures and tracks the ratio of total products sold versus the number of returned products. The higher this rate, the higher the chance of customer and revenue churn. The lower this ratio, the greater the chance of repeat purchases from existing customers.
- Reduce the Days Sales Outstanding (DSO) – The Days Sales Outstanding (DSO) KPI measures the average number of days that customer receivables remain outstanding before they are collected. The DSO demonstrates how well your company’s accounts receivables or debtors accounts are managed. It shows how committed customers are to keeping a positive working relationship with your company.
- Net Promoter Score – The Net Promoter Score quantitatively measures the overall general customer satisfaction and loyalty to your brand. This rating demonstrates the extent to which your customers are content and willing to refer your products or services to other potential clients.
- Reduce the time between purchases – The time taken between purchases demonstrates the time it takes for an average customer to buy from you again. The shorter the time, the better as it proves how happy customers are with your products or services, reducing their willingness to purchase from your competitors.
- Improve the loyal customer rate – The loyal customer rate measures the number of customers who have purchased your products more than once over time. Since your most loyal customers buy from you the most, this metric identifies the percentage of your customer base that is loyal to your brand.
- Increase the Customer Lifetime Value – The Customer Lifetime Value KPI is defined as the total revenue earned from a customer over the entire period of their relationship with the company. It costs less to retain an existing customer than to acquire new customers. Improving this metric’s value is a great way to drive business growth.
View less
Helpdesk Objectives
Helpdesk objectives are Key Performance Indicators centered around your business’s customer service and customer support activities. If you manage or own a customer helpdesk organization, your business’s core efficiencies are based around these helpdesk objectives. And they are designed to ensure optimal functioning through the measurement of these core efficiencies.
- Improve the clarity of the helpdesk objectives – By working with these helpdesk objectives, you’ll gain a clear understanding, or clarity, of how and where to improve your customer service and customer support activity performance. If some of your call center agents are underperforming, you’ll be able to solve the issues by offering support, training, and motivation.
- Improve service center agent accountability – This accountability metric ensures that agents are held responsible for their performance, responsibilities, and duties in the key customer-facing areas. Precise, digestible data in the form of a customer service report will provide the evidence for and against agent accountability levels, forcing everyone to be held accountable for their actions.
View all
- Improve customer engagement levels – Customer engagement is defined as all of the interactions between your business and your customers. In order to ensure positive customer relationships, it is essential to improve customer engagement levels. This will guarantee a positive impact on your brand’s voice and authority, as well as your overall customer-facing performance levels.
- Loyalty – Both customer loyalty and support staff loyalty are essential elements of a successful business. If your support staff are happy, motivated, and engaged, their reliability and performance will increase. If your customers are satisfied with the level of service you offer them, your chances of repeat custom will improve exponentially.
- Improve the first response rate – The first response rate or time (FRT) is the average time an agent takes to respond to a customer query. This is the first step in finding a solution to the client’s question; a response is vital for customer satisfaction. The lower the FRT, the higher the customer satisfaction levels.
- Improve customer satisfaction levels – Customer satisfaction is defined as how satisfied your customers are with the service they receive from your customer support staff. Happy and satisfied customers will remain loyal to your brand, while dissatisfied customers will move away from your brand and into your competitor’s arms.
- Improve the rate of resolution – The rate of resolution is defined as the rate at which your customer support agents resolve and close support tickets. Customer satisfaction is directly and heavily correlated to the rate at which support queries are resolved, especially within the first exchange between the agent and the client.
- Improve agent utilization rates – Maintaining an optimal agent utilization rate is critical to providing a happy, healthy work environment. Too few agents employed in relation to the number of support tickets received results in unhappy clients, unhappy customers, increased customer churn rates, and high agent turnover rates. Happy agents equal satisfied clients.
- Improve the cost per ticket – The cost per ticket is a measure of how effective your customer support center is. It is calculated by dividing the total monthly operating expense by the number of support tickets handled for the month. It is also a useful way to measure the efficiency of the processes and agents.
- Wait time – The wait time is the length of time it takes for a query to be resolved after the first exchange. A long wait time translates into poor customer support, which increases the customer churn rate. It is essential to keep the wait time to the minimum to ensure satisfied customers.
- Improve the ticket churn KPI – Customer support ticket churn or backlog is the number of unresolved or open tickets left in the system. A high number of unsolved tickets could indicate a systemic problem. Or, it could just be procedural oversight. This metric helps management determine whether there is a systemic issue or procedural oversight.
- Improve the new ticket KPI – The new ticket KPI measures the volume of new or incoming customer support tickets. A ticket creation report shows you the volume of requests your support team is handling per day, week, or month; enabling you to plan staffing requirements to meet the growing number of customer support queries.
- Improve the ticket volume by support channel – The ticket support volume by channel is the number of support tickets resolved as received by the different contact channels such as phone, chat, web form, via email, or even the social network channels. All of the support tickets received via each channel must receive the same attention.
- Increase the number of support tickets closed or solved – The number of support tickets closed or solved translates into the amount of customer support queries successfully handled. In a healthy support desk system, your new and resolved ticket trend lines should be parallel. By studying these metrics, you can determine if your team is consistently behind or not.
- Improve the ticket backlog – The ticket backlog determines how effectively the customer support department is managing its ticket workload. A lower backlog number is better than a higher backlog metric. One of the most important things helpdesk managers care about is the backlog in their support queue. Too many requests will build a backlog.
- Improve the predicted ticket backlog – Looking at your predicted backlog can help you prepare for the future by forecasting the number of support tickets that must be handled by the support staff. Planning for the expected increase or decrease of upcoming support request volume will help streamline your department and increase its productivity and efficiencies.
- Improve customer satisfaction ratings – Customer satisfaction is a measurement that determines how satisfied consumers are with the company’s customer service levels. This is an essential metric to measure as unhappy customers will not purchase the company’s products or services. This metric is useful to determine whether there are problems with your customer support organization.
- Individual performance – The individual performance metric identifies and monitors which customer support agents are top performers and which agents need additional training. Tracking this metric is also useful to see which agents are ready to take on more challenging roles and which employees might require additional training and resources.
- Improve the knowledge sharing function – Every customer service agent needs to have easy access to a comprehensive, robust, and well-maintained knowledge base. It is essential to ensure the knowledge base’s continued value. This repository must be monitored and updated, including the frequent reviewing of the creation of quality new and relevant content.
- Improve agent satisfaction levels – Satisfied employees are productive employees. Therefore, it is necessary to monitor the well-being or happiness of your customer service staff. Management should track and monitor agent turnover and attendance rates, agent satisfaction vs. customer satisfaction, and the average number of calls per agent. These metrics will show employee satisfaction levels.
View less
Problem Management Objectives
Problem management KPIs are focused on identifying, resolving, and preventing recurring IT incidents. These objectives aim to minimize the impact of IT issues on the organization and ensure IT services meet the business’s needs. It also measures the effectiveness of the problem management process in addressing IT incidents.
- Number of problems registered – We aim to increase the number of problems registered, ensuring that all issues are properly tracked and managed by the problem management team during a specified time frame.
- Number of problems solved – We aim to increase the number of problems solved, resolving more issues within the given time frame to improve system efficiency and minimize disruptions.
View all
- Number and percentage of problems with root cause identified – We aim to increase the percentage of problems with root cause identified, ensuring that more registered problems have their root cause pinpointed to expedite resolution.
- Number and percentage of problems with workaround available – We aim to increase the number and percentage of problems with workarounds available, ensuring more issues can be resolved quickly with an available workaround while waiting for permanent fixes.
- Average age of a problem, per business impact – We aim to reduce the average age of a problem, per business impact, minimizing the time a problem remains unresolved, especially those with a significant impact on specific organizational areas.
- Percentage of incidents related to (caused by) problems in relation to all incidents in a particular time period – We aim to reduce the percentage of incidents related to problems, lowering the rate of incidents caused by unresolved problems over time, thereby improving business operations.
- Update frequency of open problems – We aim to increase the update frequency of open problems, ensuring problem analysts provide timely updates to management, keeping track of the progress on open issues.
- Average time to diagnose – We aim to reduce the average time to diagnose, minimizing the time it takes to identify the root cause of a problem and isolate errors caused by it.
- Average time to fix – We aim to reduce the average time to fix, ensuring faster implementation of solutions once a problem has been diagnosed.
- Number of new problems – We aim to improve the management of new problems, ensuring all newly recorded problems during a specified time frame are addressed efficiently.
- The average cost to solve a problem – We aim to reduce the average cost to solve a problem, minimizing the financial burden of recurring issues by implementing more effective long-term solutions.
- The ratio of the number of incidents versus the number of problems – We aim to improve the ratio of incidents versus problems, ensuring fewer incidents are caused by unresolved problems.
- The number of business disruptions caused by problems – We aim to reduce the number of business disruptions caused by problems, minimizing IT service downtime by effectively resolving problems.
- Average problem closure duration – We aim to reduce the average problem closure duration, ensuring problems are resolved and closed more quickly from the time they are registered.
View less
Customer Success Objectives
The success of your customers can lead to higher sales and revenue. The customer success team aims to keep clients engaged and productive, while also growing recurring revenue. KPIs for customer success measure the effectiveness of these efforts and help track progress towards these goals.
- Improve portfolio growth – The portfolio growth KPI measures the increase in the number of new clients in the customer success manager’s portfolio. The greater the number of new clients, the higher the chance of receiving recurring revenue over time.
- Improve the Monthly Recurring Revenue (MRR) rate – The Monthly Recurring Revenue (MRR) rate is defined as the total value of predictable revenue that the company can expect monthly. The MRR KPI tracks and measures this rate over time. It tracks monthly recurring revenue figures and provides insight into the month-to-month differences in the recurring revenue.
View all
- Improve the account retention rate – The account retention rate KPI measures the number of accounts retained in a customer success manager’s portfolio over time. The higher this number, the greater the chance of increasing recurring revenue streams.
- Improve referrals – The number of referrals metric measures and tracks the number of word of mouth referrals and other promotional activities such as reviews and case studies over time. The higher the number of referrals, the greater the chance of accruing new customers.
- Increase in product adoption – The increase in product adoption KPI measures the number of users who use more of the product’s features over time and how often they use the product. The more product features clients use, and the frequency with which they use this product, the greater the chance of increasing revenue streams.
- Lower the number of support tickets – The lower the number of support tickets KPI measures the number of user support tickets that a customer success team receives over time. Users who have been onboarded correctly will require less customer support. A reduced number of support tickets means that the customer success team is doing its job.
- Faster onboarding – The faster onboarding KPI measures how quickly new customers are onboarded. Customers onboarded quickly will start to use the product earlier, achieve their desired outcomes faster, and will be able to get to their ROI more quickly.
- Improve the number of monthly onboarding – The number of monthly onboarding KPI measures the number of customers successfully onboarded each month. The greater the number of customers successfully onboarded each month, the higher the financial returns.
- Improve the customer health mix – The customer health mix KPI measures and tracks the percentage of customers who have Good/Average/Poor account health. The aim is to decrease the number of “not-good” customers and increase the number of customers with “good” account health.
- Improve product stickiness – The product stickiness KPI measures the number of customers who spend more time and use multiple features of your product. The greater the value of this metric, the stickier and more successful your product is.
- Improve expansion revenue – The expansion revenue KPI measures the percentage of new revenue that is coming from existing customers. It demonstrates how well your customer success team can get existing customers to stay and grow with the product.
- Improve customer satisfaction – The customer satisfaction KPI measures how satisfied or happy customers are with the product. The higher their satisfaction levels, the greater the chance of existing customers staying and growing with the product.
- Qualitative customer feedback – The qualitative customer feedback KPI measures and tracks how customers feel about your product. It is essential to monitor their feedback. What are they saying about you and the service you provide? What do they like and not like about their connection to the company?
- Reduce customer churn rate – The customer churn rate KPI measures the number of customers who cancel their subscriptions and stop using the product. This metric is calculated both per team and individual customer support representative. A rep who maintains a healthy customer-rep relationship is likely to have a lower churn rate, and vice versa.
- Increase the Customer Lifetime Value – The Customer Lifetime Value metric is the total revenue earned from a customer over the entire period of their relationship with the company. It costs less to retain an existing customer than to acquire new customers.
View less
Customer Experience Objectives
The customer experience Objectives (KPIs) track and measure customer satisfaction and customer loyalty metrics over time. Loyal and satisfied customers will continue to support your brand by purchasing products or services; thereby, driving up your company’s sales figures and increasing its bottom line.
- Improve marketing campaign effectiveness – The marketing campaign effectiveness KPI is defined as the return on investment (ROI) derived from a marketing campaign initiative. It aims to help you evaluate your company’s overall growth rate: the higher this number, the greater the chance of increased sales figures.
- Improve direct traffic – The direct traffic KPI is the result of any interaction identified explicitly to a specific marketing activity intended to drive traffic to the company’s online (or land-based) presence. This KPI measures the direct traffic generated from the specified action. Direct traffic generates opportunities for future growth.
View all
- Improve the pages per visit – The pages per visit KPI measures and tracks the amount of time your visitors spend on your website. This is an indicator that your content is relevant and engaging, ensuring that visitors don’t lose interest and learn more about your brand and its products, answering the site’s CTA (Call-To-Action).
- Improve the Customer Acquisition Rate – The Customer Acquisition Rate measures the percentage of prospects or visitors to the brand’s website, who convert into customers. This rate is calculated by dividing the number of new customers by the total number of prospects. The lower this rate, the greater the ROI from your marketing and sales campaigns.
- Improve the conversion rate – The conversion rate KPI measures and tracks the percentage of visitors to the brand’s online or brick-and-mortar presence, who convert into loyal customers. Increased conversion rates translate into the fact that more prospects are moving along the sales funnel motivated by the positive customer experience.
- Reduce the cart abandonment rate – The cart abandonment rate measures the rate at which the eCommerce shopping cart is abandoned before the sale is completed. The low cart abandonment rates indicate a well thought out user experience, driving repeat customer purchases, and increased sales.
- Improve the customer churn rate – The customer churn rate is the percentage rate at which customers stop subscribing to a service over time. Reducing churn rates is essential to expand your client base and increase revenue streams. Low churn rates reveal satisfaction with your company’s customer service levels.
- Improve the Net Promoter Score (NPS) – The Net Promoter Score (NPS) measures how your customers feel about your brand. The lower the score, the worse your clients feel about your brand, the less the chance of retaining customers. The higher the score, the greater the probability of customer loyalty, repeat purchases, and improved sales figures.
- Improve the Customer Satisfaction Score (CSAT) – The Customer Satisfaction Score (CSAT) is a key measurement of a customer’s satisfaction with a brand’s products or services. High satisfaction scores illustrate a customer-centric culture and show that your brand has met or surpassed your customers’ expectations across all aspects of your brand’s customer experience strategies.
- Improve the Average Resolution Time – The average resolution time points to the average time it takes for a customer support agent to resolve an issue and close the support ticket. This metric directly relates to customer satisfaction, and it illustrates your customer support team’s efficiency.
- Improve the multichannel touchpoints – The multichannel touchpoints KPI measures how effective the customer-facing touchpoints are. A touchpoint is when the brand comes into contact with the customer. Multichannel touchpoints are various ways these two elements make contact with each other; the more successful the touchpoints, the greater the chance to drive up sales numbers.
- Improve the Customer Effort Score (CES) – The Customer Effort Score (CES) measures the effort a customer expends interacting with the brand’s online presence. This KPI demonstrates the user experience success rate. It should be quick and easy to find relevant information on the company’s online presence to encourage customer loyalty and drive up sales numbers.
- Improve the brand mentions – The brand mentions KPI measures the number of times your brand is mentioned on social media. These mentions will either be positive or negative. Keeping track of the number of social media mentions and the types of statements made is a great way to evaluate customer experience.
- Improve the self-service rate – The self-service rate KPI measures the percentage of customers who would prefer to solving their challenges themselves versus the number of people who need to talk to an agent. Self-service channels include community forums, FAQs, step-by-step how-to guides, and social media pages.
- Improve the Average Handle Time – The Average Handle Time is the average time it takes to handle customer service phone calls, chats, emails, or other interactions. Customers expect high service levels and a quick and suitable resolution to their queries. The lower the Average Handle Time, the greater the customer satisfaction metrics.
- Increase the time on Site – The amount of time spent on the brand’s website is an excellent customer experience measure; the higher the customer engagement metrics, the greater the chance of a successful purchase per customer.
View less
Customer service KPIs or Key Performance Indicators for customer service play an integral role in the organization’s ability to acquire, manage, and retain customers. Without efficient and customer-centric customer service, the organization will not meet its sales figures, nor will it grow. Therefore, key areas that must be measured are aspects like customer satisfaction levels, call center effectiveness like first contact resolution rate, cost per call, and average hold time and average resolution time. Also, customer account and customer relationship management are equally critical.
Real-time KPI management allows the organization to stop negative patterns from becoming the norm.